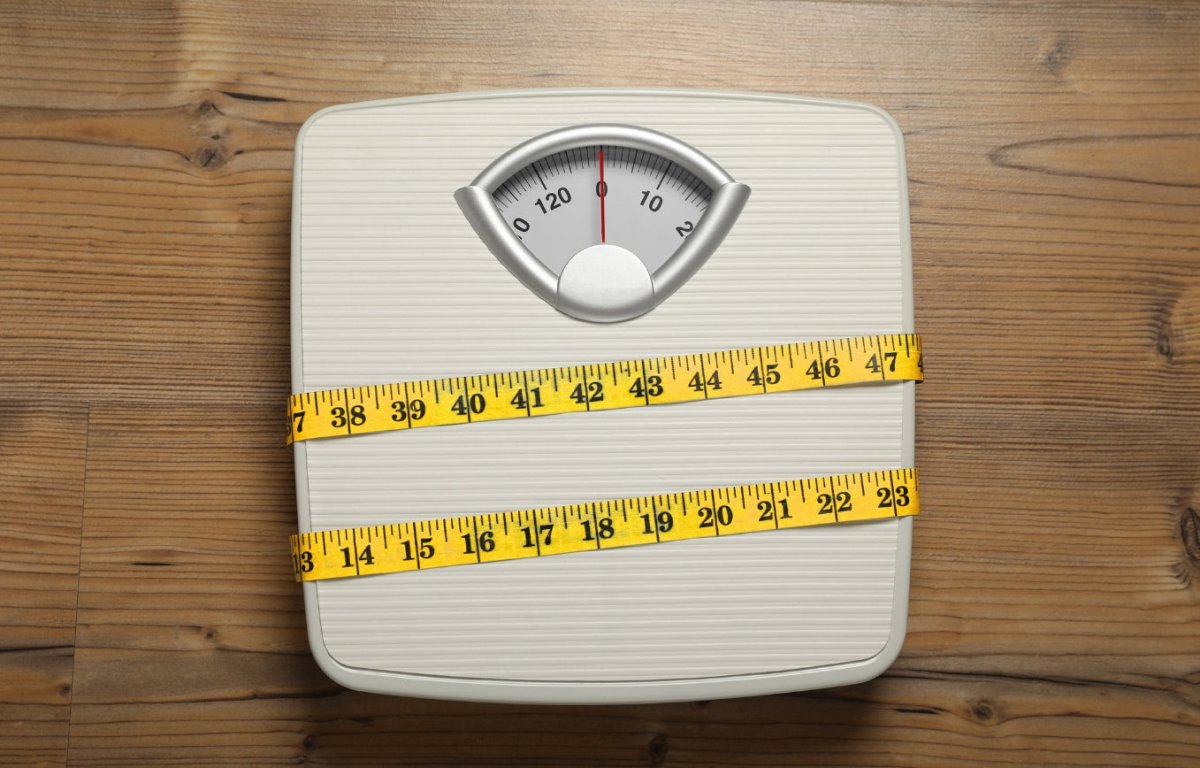
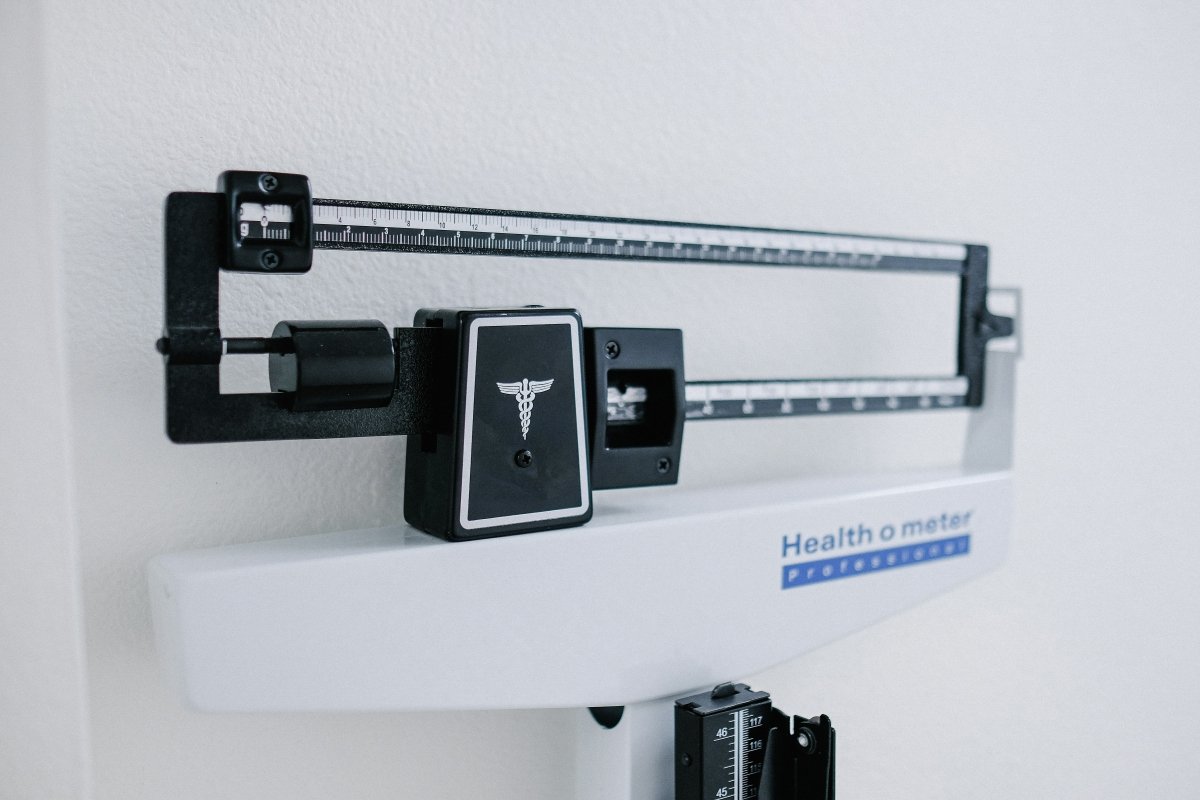
في السعي إلى فهم أفضل وإدارة السمنة، تم استخدام المقياس التقليدي لمؤشر كتلة الجسم (BMI) منذ فترة طويلة. ومع ذلك، تشير التطورات الأخيرة في تقدير تكوين الجسم إلى أن التحول من مؤشر كتلة الجسم إلى مقاييس أكثر مباشرة، مثل نسبة الدهون في الجسم (BF%)، يمكن أن يحسن إدارة السمنة. تتعمق هذه المدونة في الاختلافات بين مؤشر كتلة الجسم ونسبة الدهون في الجسم، وكيف يمكن للأخير أن يوفر نهجًا أكثر دقة وعملية لتعريف زيادة الوزن والسمنة (Potter et al., 2024).
فهم مؤشر كتلة الجسم (BMI)
مؤشر كتلة الجسم هو أداة مستخدمة على نطاق واسع لتصنيف الأفراد على أساس وزنهم نسبة إلى طولهم. يتم حسابه عن طريق قسمة وزن الشخص بالكيلوجرام على مربع طوله بالمتر (كجم/م²) (المعهد الوطني للقلب والرئة والدم، 2023). ثم يتم تصنيف القيمة الناتجة على النحو التالي:
- نقص الوزن: مؤشر كتلة الجسم < 18.5
- الوزن الطبيعي: مؤشر كتلة الجسم 18.5 - 24.9
- الوزن الزائد: مؤشر كتلة الجسم 25 - 29.9
- السمنة: مؤشر كتلة الجسم ≥ 30
يستخدم مقدمو الرعاية الصحية مؤشر كتلة الجسم كأداة فحص لتقدير دهون الجسم وتقييم المخاطر الصحية المحتملة المرتبطة بالوزن. وفي حين أن مؤشر كتلة الجسم سهل الحساب ويوفر تقييمًا سريعًا، إلا أنه يعاني من قيود ملحوظة مثل (Nuttall, 2015) :
- لا يميز بين كتلة العضلات وكتلة العظام وكتلة الدهون، مما قد يؤدي إلى تصنيف خاطئ.
- لا يأخذ في الاعتبار توزيع الدهون في الجسم
- قد لا يكون دقيقًا بالنسبة للرياضيين أو كبار السن أو مجموعات عرقية معينة
على سبيل المثال، قد يتم تصنيف الرياضيين ذوي الكتلة العضلية العالية على أنهم يعانون من زيادة الوزن أو السمنة على الرغم من انخفاض نسبة الدهون في الجسم. وعلى العكس من ذلك، قد يعاني الأفراد الذين يتمتعون بمؤشر كتلة جسم طبيعي من ارتفاع نسبة الدهون في الجسم والمخاطر الصحية المرتبطة بذلك.
لقد واجه مؤشر كتلة الجسم، وهو مقياس للسمنة تم تقديمه منذ ما يقرب من قرنين من الزمان من قبل عالم رياضيات بلجيكي، انتقادات لعدم كونه في الأصل أداة تشخيصية صحية. وجدت دراسة حديثة أجراها فيساريا وآخرون (2023) أن مؤشر كتلة الجسم يقلل بشكل كبير من انتشار السمنة مقارنة بقياسات نسبة الدهون في الجسم:
وباستخدام مؤشر كتلة الجسم، تم تصنيف 36% من البالغين على أنهم يعانون من السمنة.
وباستخدام %BF، تم تصنيف 74% من البالغين على أنهم يعانون من السمنة.
حالة نسبة الدهون في الجسم (BF%)
تقيس نسبة الدهون في الجسم (BF%) نسبة الدهون في الجسم بشكل مباشر. يقدم هذا المقياس صورة أوضح لتكوين جسم الفرد ، ويميز بين الدهون والكتلة الخالية من الدهون .
أصبحت الطرق العملية لتقدير نسبة الدهون في الجسم أكثر سهولة ودقة مثل:
- تحليل المعاوقة الحيوية الكهربائية (BIA):
يقيس تحليل تحليل الدهون الدهون في الجسم عن طريق إرسال تيار كهربائي ضعيف عبر الجسم. ويقدر تكوين الجسم بناءً على كيفية تدفق التيار عبر الأنسجة المختلفة (ليونز ريد وآخرون، 2020).
- قياسات ثنيات الجلد:
تتضمن قياسات طيات الجلد استخدام الفرجار لقرص وقياس طيات الجلد في مواقع مختلفة من الجسم. تُستخدم هذه القياسات لتقدير كمية الدهون تحت الجلد (سيلفيرا وآخرون، 2020).
- قياس امتصاص الأشعة السينية ثنائية الطاقة (DEXA):
يستخدم فحص DEXA الأشعة السينية منخفضة الجرعة للتمييز بين العظام والأنسجة الدهنية والكتلة الخالية من الدهون في الجسم. ويوفر قياسات دقيقة لنسبة الدهون في الجسم وكثافة العظام (Chaves et al., 2022).
حدود جديدة للوزن الزائد والسمنة
استناداً إلى دراسات حديثة، تم اقتراح عتبات ذات صلة سريرية لزيادة الوزن والسمنة باستخدام نسبة الدهون في الجسم على النحو التالي:
بالنسبة للرجال: نسبة الدهون في الجسم 25% تعتبر زيادة في الوزن، و 30% تصنف على أنها سمنة.
بالنسبة للنساء : تكون الحدود أعلى قليلاً، حيث يشير 36% من نسبة الدهون في الجسم إلى زيادة الوزن و 42% إلى السمنة.
تعكس هذه القيم الاختلافات في تكوين الجسم بين الجنسين وتوفر مقياسًا أكثر دقة لتراكم الدهون غير الصحية (بوتر وآخرون، 2024).
لماذا تعتبر نسبة الدهون في الجسم مقياسًا أفضل؟
- الدقة: توفر نسبة الدهون في الجسم (BF%) قياسًا مباشرًا للدهون، مما يوفر مؤشرًا أكثر وضوحًا للمخاطر الصحية المرتبطة بزيادة الدهون في الجسم.
- ارتباط أفضل بالمخاطر الصحية: تم تحديد عتبات نسبة الدهون في الجسم على أساس انتشار متلازمة التمثيل الغذائي، وهو مرض مصاحب رئيسي مرتبط بالسمنة ويشمل مخاطر القلب والأوعية الدموية. يوفر هذا النهج رابطًا أكثر مباشرة بين تكوين الجسم والنتائج الصحية.
- التخصيص: على عكس مؤشر كتلة الجسم، فإن نسبة الدهون في الجسم تأخذ في الاعتبار الاختلافات الفردية في كتلة العضلات وتوزيع الدهون.
- الحدود الخاصة بكل جنس: تسمح نسبة الدهون في الجسم بحدود منفصلة للرجال والنساء، مع مراعاة الاختلافات الطبيعية في تكوين الجسم بين الجنسين.
- التركيز على الصحة: تتوافق نسبة الدهون في الجسم بشكل وثيق مع النتائج الصحية، مثل مخاطر القلب والأوعية الدموية والصحة الأيضية، والتي تتأثر بشكل مباشر بمستويات الدهون في الجسم.
القيود المحتملة لقياس نسبة الدهون في الجسم:
- التباين في الحدود المعيارية: لا يوجد اتفاق عالمي على حدود نسبة الدهون في الجسم المحددة التي تحدد الوزن الزائد والسمنة بين مختلف السكان. وقد تختلف هذه الحدود بناءً على متغيرات مثل العمر والجنس والعرق.
- الفوارق بين الأعمار والجنسين: تتقلب نسبة الدهون في الجسم بشكل طبيعي مع تقدم العمر وتختلف بين الجنسين، مما يستلزم نطاقات مرجعية مميزة لفئات عمرية وأجناس مختلفة. وقد يؤدي هذا التباين إلى تعقيد تفسير ومقارنة قياسات نسبة الدهون في الجسم.
- قيود المعدات: بعض طرق قياس نسبة الدهون في الجسم، مثل تحليل المعاوقة الكهربائية الحيوية (BIA)، عرضة لعوامل مثل مستويات الترطيب، واستهلاك الطعام الأخير، والنشاط البدني. هذه المتغيرات لديها القدرة على إدخال عدم دقة في تقييمات نسبة الدهون في الجسم.
خاتمة
تشير الأبحاث الحديثة إلى أن الانتقال من مؤشر كتلة الجسم إلى نسبة الدهون في الجسم لتصنيف الوزن الزائد والسمنة يمثل تقدمًا كبيرًا في تقييم الصحة. مع وجود عتبات جديدة - 25٪ و 36٪ من نسبة الدهون في الجسم للرجال والنساء لتحديد الوزن الزائد، و 30٪ و 42٪ من نسبة الدهون في الجسم للسمنة - يمكن لمقدمي الرعاية الصحية الآن تقديم استراتيجيات أكثر تخصيصًا وكفاءة لإدارة السمنة. مع تقدم التقنيات العملية لقياس تكوين الجسم، فإن نسبة الدهون في الجسم في وضع يسمح لها بالظهور كمعيار مفضل لتقييم السمنة وإدارتها (Potter et al.، 2024).
مراجع:
- Chaves, LGC de M., Gonçalves, TJM, Bitencourt, AGV, Rstom, RA, Pereira, TR and Velludo, SF (2022). تقييم تكوين الجسم عن طريق قياس كثافة الجسم بالكامل: ما يجب أن يعرفه أخصائيو الأشعة. Radiologia Brasileira، [متاح على الإنترنت] 55، ص 305-311. doi:https://doi.org/10.1590/0100-3984.2021.0155-en.
- جاييدي أ، سولتاني س، زارغار م س، خان ت أ، شاب بيدار س. السمنة المركزية وخطر الوفاة لأي سبب: مراجعة منهجية وتحليل استجابة الجرعة لـ 72 دراسة مجموعة مستقبلية. المجلة الطبية البريطانية. 2020؛ 370.
- لاسكي، ما (1996). قياس امتصاص الأشعة السينية ثنائية الطاقة وتكوين الجسم. التغذية (بوربانك، مقاطعة لوس أنجلوس، كاليفورنيا)، [متاح على الإنترنت] 12(1)، ص. 45-51. doi:https://doi.org/10.1016/0899-9007(95)00017-8.
- ليونز-ريد، جيه، وارد، إل سي، كينالي، تي، وكوتفيلد، دبليو (2020). تحليل المعاوقة الكهربائية الحيوية - أداة سهلة لقياس تكوين الجسم في مرحلة الطفولة؟ العناصر الغذائية، [متاح على الإنترنت] 12(4). doi:https://doi.org/10.3390/nu12040920.
- المعهد الوطني للقلب والرئة والدم (2023). احسب مؤشر كتلة الجسم - حاسبة مؤشر كتلة الجسم القياسية. [متوفرة عبر الإنترنت] Nih.gov. متوفرة على: https://www.nhlbi.nih.gov/health/educational/lose_wt/BMI/bmicalc.htm.
- نوتال، ف.كيو (2015). مؤشر كتلة الجسم. التغذية اليوم، [متاح على الإنترنت] 50(3)، ص.117-128. doi:https://doi.org/10.1097/nt.00000000000000092.
- بوتر، إيه دبليو، تشين، جي سي، لوني، دي بي، فريدل، كي إي (2024). تعريف الوزن الزائد والسمنة من خلال نسبة الدهون في الجسم بدلاً من مؤشر كتلة الجسم. مجلة الغدد الصماء والتمثيل الغذائي السريرية، [متوفرة على الإنترنت] ص.دجاي341. دوي:https://doi.org/10.1210/clinem/dgae341.
- Silveira, EA, Barbosa, LS, Rodrigues, APS, Noll, M. and De Oliveira, C. (2020). تقييم نسبة الدهون في الجسم من خلال معادلة ثنية الجلد، والمقاومة الحيوية وقياس الكثافة لدى كبار السن. أرشيف الصحة العامة، [متاح على الإنترنت] 78(1). doi:https://doi.org/10.1186/s13690-020-00449-4.
- Visaria, A., Heo, J., Jang, Y., & Yoo, S. (2023). انتشار السمنة بناءً على نسبة الدهون في الجسم مقابل مؤشر كتلة الجسم. تم تقديمه في ENDO 2023، الاجتماع السنوي لجمعية الغدد الصماء، في شيكاغو، إلينوي.


يشارك:
بروتين مصل اللبن وGLP-1s: نهج أساسي لإدارة الوزن وصحة العضلات
هل يمكن أن يسبب GLP-1 آلام العضلات؟